Lauren and Jenna completed their Visualization and Design: Fundamentals summer class. They both used zine metadata for their final projects.
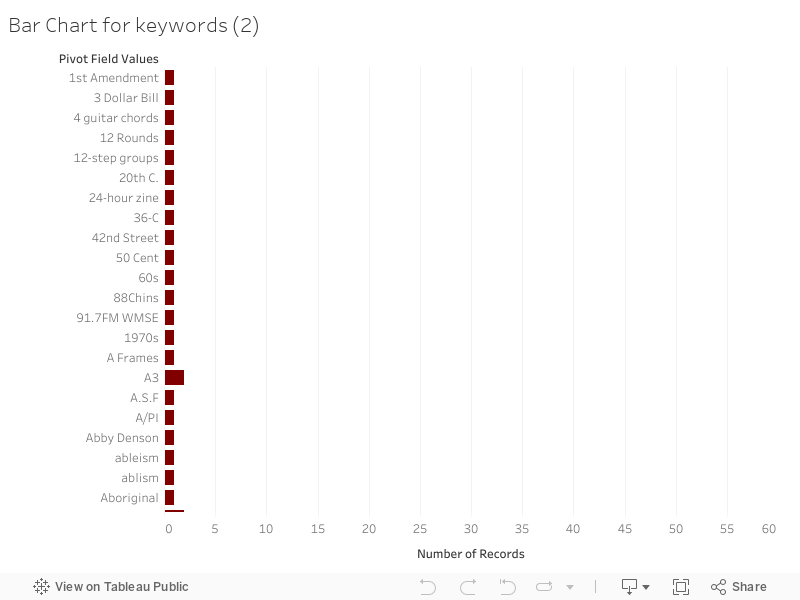
Lauren’s focused on keywords from the Queer Zine Archive Project and Jenna’s was about genre terms at the Barnard Zine Library.
Here’s a taste of Lauren’s

And a morsel of Jenna’s

Lauren’s project on Github pages. Lauren’s white paper is included on her Github.
Jenna’s project on Github pages. Jenna’s white paper is available via pdf.
Let us know what you think!